Nuclear Power Statistics
According to the latest data of 2020, 440 nuclear power reactors are operable around the world. The combined capacity of electricity generation from these reactors is 390 GW.
In addition to that, 55 nuclear reactors are under construction with 109 reactors planned for installation. Moreover, 329 nuclear reactors are under the proposition.
The combined capacity of the reactors under planning is 63 GW and 118 GW.
How much Nuclear Fuel is left in the world for future use?
As per the data of NEA, there is 5.5 million metric tons of identified Uranium resource is left.
Additionally, there are still 10.5 million metric tons is undiscovered.
With the rate of consumption in today’s date, the supply of nuclear fuel can last up to approximately 230 years worth of supply.
As of 2018, nuclear energy is the second low-carbon power with a percentage of 29% emission rates.
Top 3 Nuclear Power Station in the World
Kashiwazaki-Kariwa Plant in Japan with a net capacity of 7,965 MW is the world’s largest Nuclear Power Plant, as of today. It has 7 BWR with a gross capacity of 8,212 MW.
Bruce Nuclear Generating Station in Ontario, Canada is the second largest with a capacity of 6,430 MW. It has 8 PWR with gross capacity varying between 786 MW and 891 MW.
Hanul Nuclear Power Plant in South Korea has a capacity of 5,908 MW. It has 6 PWR as of Phase I. in Phase II 2 more reactors are added to the development plan.
History of Nuclear Energy
- In the 1950s, the world’s first commercial nuclear power station was established and started operating.
- Chicago Pile 1 is the world’s first nuclear reactor to be built by Enrico Fermi. It was built underneath the Stagg Field Football Stadium in the University of Chicago.
- Enrico Fermi led a group of scientist in the effective initiation of first-self sustaining nuclear chain reaction.
- The construction of Experimental Breeder Reactor I in Idaho was authorized by the AEC. The reactor on December 20, 1951, first generated electricity from nuclear energy.
- Started in 1960, in the USA, Westinghouse designed the first fully commercial Pressurized Water Reactor (PWR). Yankee Rowe Nuclear Power Station with a capacity of 250 MWe operated until 1992.
- Argonne National Laboratory developed the Boiling Water Reactor.
- The first BWR Dresden-1 with a capacity of 250 MWe, is designed by General Electric which started early in 1960.
- Today, 69% of the world is utilizing PWR and 20% of BWR.
Nuclear energy of American Continent
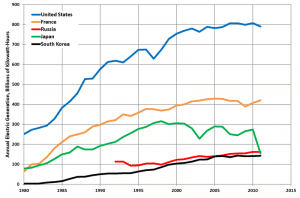
United States of America: The US is the largest nuclear electricity producer with 809,359 GW/h as of 2019.
There are 94 operable nuclear reactors, with a net capacity of 96.6 GWe.
Canada: With 19 operable nuclear reactors and a capacity of 13.6 GWe, Canada generated 15% of the country’s electricity in the year 2019.
One out of 19 nuclear reactors is established in Ontario.
Mexico: In 2019 Mexico generated 4.5% of electricity with 2 operable nuclear reactors and a net capacity of 1.6 GWe.
Argentina: As of 2019, Argentina had produced 6% of its country’s electricity with 3 nuclear reactors and a net capacity of 1.6 GWe.
Brazil: 3% of the country’s electricity was produced in 2019, with 2 reactors and 1.9GWe of combined net capacity.
Top 5 Nuclear Power Station in the US according to their net capacity in MWe
- Palo Verde with 3 units and a net capacity of 3,942 MWe
- Browns Ferry with 3 units and a net capacity of 3,300 MWe
- South Texas with 2 units and a net capacity of 2,560 MWe
- Oconee with 3 units and a net capacity of 2,538 MWe
- Susquehanna with 2 units and a net capacity of 2,429 MWe